How to calculate COVID-19 stats for your area

A doctor looks at the level of individuals – how to heal and care for one patient at a time. An epidemiologist looks at a whole group of people – population data for population health. Epidemiology is the study of information based on groups of people. "The only way to know how a disease affects a population is to look at the collective data," says Deborah Levy, PhD, MPH.
Dr. Levy serves as professor and former chair in the Department of Epidemiology in the College of Public Health at University of Nebraska Medical Center. Previously, she spent 20 years as an epidemiologist at the Centers for Disease Control and Prevention.
Dr. Levy says epidemiologists think about three key things: person, place and time.
- Person: Who is most likely to get a disease? What medical conditions make someone more vulnerable?
- Place: How is the disease spreading in a city, state or country? Size and location matter. Plus, there are geographic differences like culture, access to health care, lifestyle, government and population density. A statistic in Iceland may mean something different in Nebraska. Where we live, work and play affects the spread of disease
- Time: The length of the incubation period, how long your exposure is, when someone is exposed and how long sick people are contagious – all of these relate to timing
Below we explain these important COVID-19 statistics so you can think like an epidemiologist. While considering person, place and time, we'll look at:
- Test positivity rate
- Tests per capita (tests compared to population)
- Case fatality rate (deaths as a proportion of cases)
- Positive cases per capita (confirmed cases per capita)
1. Test positivity rate
How it's calculated: Take the number of positive tests for a length of time (like the number of positive tests from one day or one week). Divide it by the total number of tests for the same time period.
What it means: The test positivity rate measures both the outbreak's severity and the limitations of testing.
Should it be high or low? A lower positivity rate is better. A decreasing positivity rate means either fewer people are infected or you're testing more of the population.
In May, the positivity rate was over 20% in Douglas County. Dr. Levy says, "Because of the lack of available tests, they were only testing people who were quite sick. So in that time, positivity rate wasn't just an indication of the surging outbreak. The high positivity rate was also because there wasn't enough testing."
The WHO recommends a 5% positivity rate or lower. But positivity rates are only valid and accurate if you're testing appropriately and honestly. If COVID-19 outbreaks are surging in an underserved, minority community, but you don't test there, your positivity rate isn't a valid statistic. Because you didn't test in the area you needed to test.
If you go from testing only the really sick people (high positivity rate), then expand the testing (offer many more tests than before), the positivity rate will drop. "If you test lots of people, you should see the positivity rate decrease," says Dr. Levy. "And that doesn't mean that you've reduced how many people have the disease in the population. It means that there's more available testing."
A positivity rate can tell you whether you're getting an outbreak under control – but only if testing is equally available to everyone. The total number of tests should be a good representation of the whole community. Access to testing shouldn't be affected by where you live.
Douglas County positivity rate: How are we doing?
Douglas County has an 10.8% positivity rate as of this writing. That's more than double the recommended 5% or lower.

Lancaster County positivity rate: How are we doing?
Lancaster County has a 9.2% positivity rate as of this writing.

2. Tests per capita
How it's calculated: Take the total number of tests a place has given. Then divide it by the number of people who live in that place.
What it means: How many people – proportionally – have access to testing.
Should it be high or low? Increasing testing helps track the outbreak, so it's good to increase tests per capita. Higher tests per capita keep the test positivity rate low.
Tests per capita is closely related to test positivity. Tests per capita tells you if enough people are being tested and should increase as cases increase in the community.
When you don't have enough tests available, it's impossible to catch every case. That means there are COVID-19 infections not recorded in the official counts – the question is how many?
Testing needs depend on two things: population size and outbreak size. You need to test more in a city the size of Omaha than a small town. But testing also depends on the size of the outbreak. "Testing should be scaled to the size of an epidemic in an area, not just the size of the population," says Dr. Levy. Since Douglas County has an 11.2% positivity rate as of this writing, testing should increase.
Tests per capita means "per unit of person." To compare tests per capita across different areas, you can use different scales – like per 100,000 people or per 1 million. The UNMC College of Public Health recommends 200 to 300 tests per 100,000 people every day.
Douglas County tests per capita: How are we doing?
- Douglas County has a population of about 571,000.
- Testing 200 per 100,000 per day is 1,142 tests every day or 7,994 per week.
- Testing 300 per 100,000 per day is 1,713 tests every day or 11,991 per week.
- Go to # Total Daily or # Total Weekly on the Douglas County dashboard to see how we're doing.
- The last full week had 6,220 tests, which is lower than both of the recommended guidelines.

Lancaster County tests per capita: How are we doing?
- Lancaster County has a population of about 319,000.
- Testing 200 per 100,000 per day is 638 tests every day or 4,466 per week.
- Testing 300 per 100,000 per day is 957 tests every day or 6,699 per week.
- Go to # Total Daily or # Total Weekly on the Lancaster County dashboard to see how we're doing.
- The last full week had 2,540 tests, which is lower than both of the recommended guidelines.

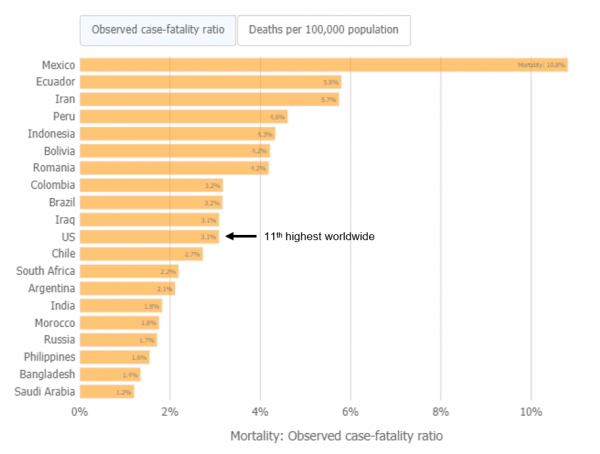
3. Case fatality rate
How it's calculated: Take the number of COVID-19 deaths in a population. Divide that by the total number of COVID-19 cases and multiply by 100. This is typically expressed as a percentage.
What it means: A case fatality rate tells you how severe a disease is. It also measures how effective treatments are, on average.
Should it be high or low? The lower the case fatality rate, the better.
If more people die from a disease, the case fatality rate increases.
Case fatality rate can't measure how many people have the disease. You can have a growing positivity rate and a declining fatality rate for two reasons:
- Many infected people could have no symptoms or a mild case. This would decrease the case fatality rate.
- The virus could be spreading among healthier, younger individuals who are less likely to die, so they would not increase the case fatality rate.
Right now, the outbreak is spreading among younger people. Younger people don't die as frequently as older people, but the outbreak is still growing.
What the case fatality rate also measures is how well we're able to treat the disease. "The case fatality rate has decreased since March, because we're learning how to treat COVID-19," says Dr. Levy. "The way doctors treat severe cases has changed."
For example, doctors used to put severe COVID-19 patients on ventilators. But pushing the air through the lungs would sometimes damage the patients' lungs further. Now certain patients receive oxygen up the nose, which gives them a better chance of survival without damaging the lungs. For other patients, the ventilator helps but is dialed down so there's less force pushing the air in. More patients are placed on their stomachs to help them breathe better. As doctors learn how to best treat COVID-19, case fatality rate should decrease.
If hospitals go above capacity, like they did in New York City, the case fatality rate will increase. Even if we know what treatments work better now, we still need enough staff and beds to treat COVID-19 patients.
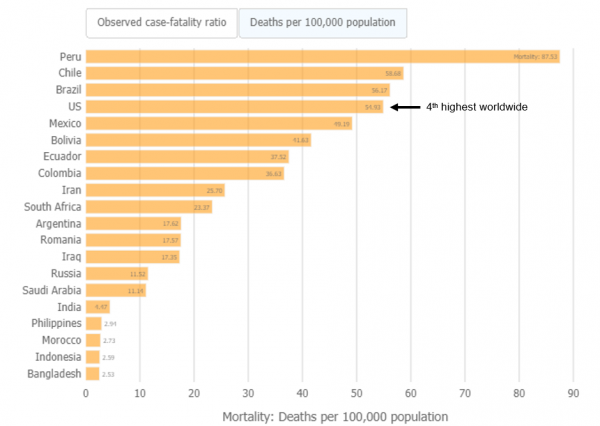
What about mortality rate?
A case fatality rate (deaths as a proportion of cases) is different from a mortality rate (deaths as a proportion of population). The mortality rate refers to the proportion of the population that dies due to a disease. Mortality rate differs from the case fatality rate, because not everyone in a population becomes infected with a disease. The United States mortality rate remains one of the highest in the world.
4. Positive cases per capita
How it's calculated: Take the number of positive cases in one area (say, Douglas County). Then divide it by the number of people who live in the area.
What it means: How much the disease is spreading, relative to the total population size.
Should it be high or low? Decreasing the positive cases per capita is good.
Positive cases per capita, also called confirmed cases per capita, differs from test positivity rate. Test positivity rate looks at how many tests are confirmed COVID-19 cases versus all the tests performed. Positive cases per capita compares how many positive cases are in an area, relative to the total population. Positive cases per capita give you information about community transmission/spread of the disease, while positivity rate shows you how well you are doing at finding cases.
| How rapidly is COVID-19 spreading in the community? | Number of positive COVID-19 cases per 100,000 per day |
|---|---|
| Red: Uncontrolled substantial spread | 5.1 or more cases |
| Orange: Controlled substantial spread | 2.6 to 5.0 cases |
| Yellow: Moderate spread | 0.5 to 2.5 cases |
| Green: Low spread | Less than 0.5 cases |
Source: College of Public Health K-12 Playbook
Douglas County positive cases per capita: How are we doing?
- Calculate the seven-day average per day by dividing "cases in last 7 days" by seven
- Seven-day average number of cases is 85.4, as of Aug. 27
- Douglas County has a population of about 571,000
- Positive COVID-19 cases per 100,000 per day: 15.0
- Status: Uncontrolled substantial spread (red), because 15.0 is more than 5.1 cases per 100,000 per day
Lancaster County positive cases per capita: How are we doing?
- Calculate the seven-day average per day by dividing "cases in last 7 days" by seven
- Seven-day average number of cases is 31.6, as of Aug. 27
- Lancaster County has a population of about 319,000
- Positive COVID-19 cases per 100,000 per day: 9.9
- Status: Uncontrolled substantial spread (red), because 9.9 is more than 5.1 cases per 100,000 per day
Get local COVID-19 data
Find real-time info on cases and deaths on the COVID-19 dashboards for Douglas and Lancaster counties. Data comes from the Douglas County Health Department and the City of Lincoln/Lancaster County Health Department, respectively. You can also see Nebraska data in the New York Times and The COVID Tracking Project.
How do epidemiologists do it?
These metrics are a snapshot of the disease in the community – what has already happened. There are also metrics that help you understand how well you are responding to the outbreak. Epidemiologists use the strategy of test, trace and isolate to limit the reach of an infectious disease. A skilled public health response can slow the spread of COVID-19.
Hopefully, this high-level overview gave you a better understanding of COVID-19 statistics. If you're a bit confused, fear not. It takes years of training to understand these fast-moving numbers. Experienced epidemiologists at the UNMC College of Public Health are trained to interpret and apply difficult statistics like these to everyday life. UNMC researchers and Nebraska Medicine doctors continue to provide accurate, up-to-date guidance for everything from meatpacking plants to K-12 schools. We work hard at interpreting COVID-19 statistics so you don't have to.